Transparent
Supply Chains

Transparent
Supply Chains

Transparent
Supply Chains

TSC Impact Report 2018

For Better Business

Foreword

This is The Sustainability Consortium’s (TSC) third annual Impact Report. This report, like the two before it, focuses on how well companies are using the organization’s tools to peer into their supply chains. Over the course of the three reports, TSC has seen expanded use of The Sustainability Index and key performance indicators (KPIs) such that it now covers hundreds of billions in consumer purchasing.

While use of TSC’s tools is growing, I’d liken the experience of the first TSC Impact Report to that of peering through a keyhole. And now it feels like there’s a foot in the door holding it partially ajar, affording a much better view. But why all the effort to fling open this proverbial door so we can have a clear look back across the supply chains that support the products we all use in our daily lives as consumers? Simply put, because supply chains are where both the impacts and the opportunities for improvement are concentrated:

Impacts are heavily concentrated in supply chains. For most consumer-facing companies, 80-90% of the total end-to-end environmental and social impacts are embedded in the upstream supply chain. For some categories, consumer use and end-of life decisions are also hot spots for impacts. But in few cases are the direct operations of a consumer-facing company the largest part of the puzzle – and so to deliver at-scale improvements its critical to look up- and downstream at the entire system a company operates within.

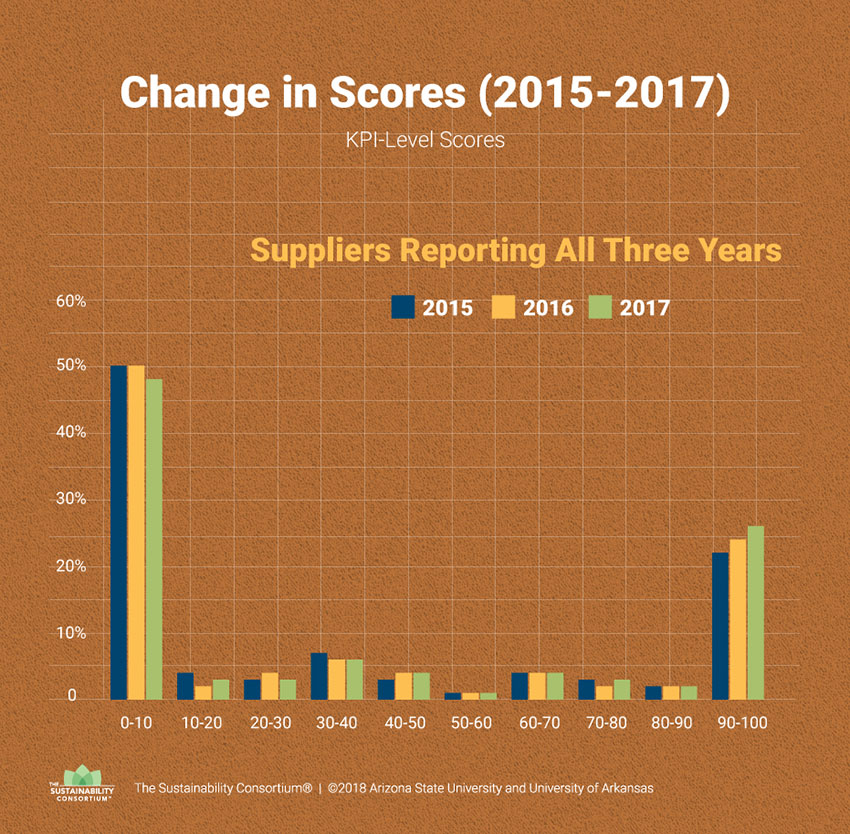
There’s tremendous room for improvement. Now that TSC has been issuing this report for three years, a track record is emerging. What that track record is clearly showing is A) that solid improvements are being made year-over-year, and B) that even with these improvements, there is still plenty of room to improve.

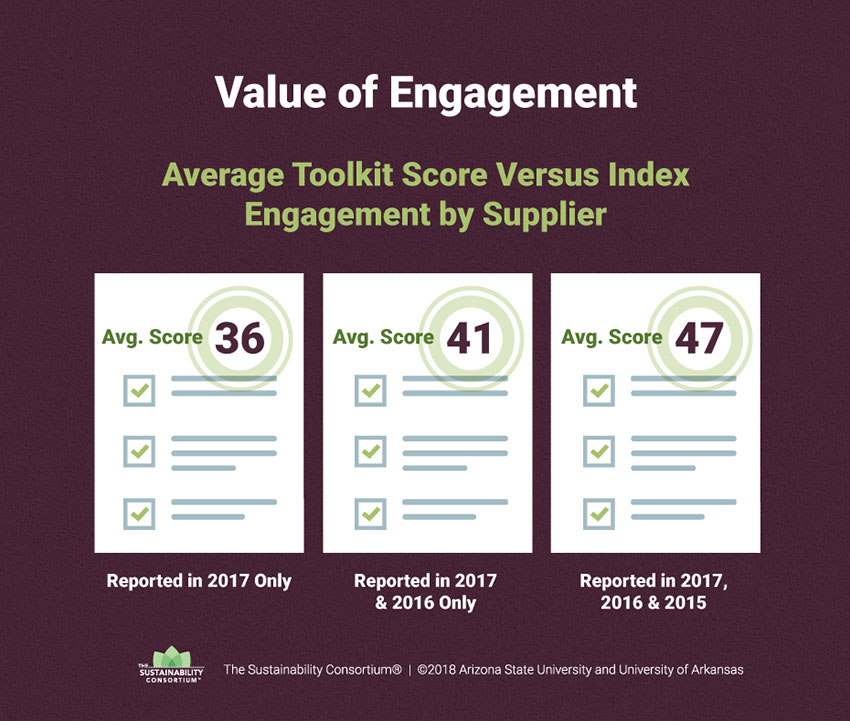
This concentration of both impacts and opportunities for improvement makes supply chains a uniquely powerful place for large companies to focus sustainability efforts. As shown in the examples in this report, one company, or a small group of companies, can set off a chain reaction of tracking and transparency. When a supplier reports data to a many-to-many ecosystem like TSC, all the participating members doing business with that company can get access to the data. In this way, supply chains are a powerful point of amplification.

Supply chain sustainability efforts aren’t just about managing or mitigating the environmental and social impacts of supply chains – these efforts go straight to the root of business value creation. While at McKinsey & Company, my colleague Anne-Titia Bové and I did extensive research on the linkage between sustainability efforts and the profitability and market capitalization of consumer-facing companies. We found that for the 50 largest consumer goods companies in the world, only 50% of their market capitalization was the based on their ability to generate profit today. The other 50% of their market value was based on the expectation that they’d grow their profits in the future.

Without getting deeply into supply chains and driving sustainability improvements, this future growth would come with a linear set of increases in environmental and social sustainability impacts: sales go up 10%, impacts go up a corresponding 10%. These types of linear increases in sustainability impacts would fly in the face of global efforts to address common global sustainability goals set by nearly every government on Earth. In fact, if the 50 largest global consumer goods companies we looked at are to do their fair share to meet the Paris climate agreements and deliver on the growth expectations already priced into their stock, they’ll have to find ways to deliver a dollar of sales in 2050 with only about 10% of the CO2e that same dollar of sales would have had in 2015. Through this lens, supply chain sustainability efforts are an insurance policy on a company’s market capitalization – efforts to de-intensify the environmental and social impacts in supply chains support the continued ability of companies to grow, and expectations of continued growth are what support public capital markets view of the company’s value.

I can’t speak specifically for the CEO of your organization, but I can say that all of the CEOs I know care an awful lot about things that have the ability to impact the value of their company by 50%. And so, at a time when there is a massive international effort going into meeting the commitments of the Paris Agreement, when companies around the world are embracing the concept of science-based targets and committing to do their fair share to get on the so-called two degree (or less) pathway, there is a spotlight on supply chains. TSC’s leading tools are helping companies tackle what is perhaps the hardest part of the journey toward two degrees – pulling the multi-tiered, global, complicated supply chain sitting underneath practically every company today forward towards a better collective future.

Steve Swartz Headshot

Steve Swartz
Chief Strategy Officer
The Wonderful Company

Welcome From TSC’s Chief Executive

Dear Readers,

We are delighted to bring you our third TSC Impact Report, “Transparent Supply Chains for Better Business”.

Since our first report in 2016, we’ve seen a growing number of suppliers commit to measuring and improving their sustainability and building transparency into their business models. As Chief Executive of TSC, I am often asked, “But to what end?”. It’s all well and good that the numbers are trending in the right direction for measuring sustainability progress–and TSC is proud to be a driver of that momentum–but is all this work creating better and more sustainable businesses and business practices?

The answer is yes: visibility into supply chains makes businesses better.

Every day we see more evidence that sustainability and better businesses go hand-in-hand. Well-run companies are typically the sustainability leaders and sustainability leaders are typically well-run companies. Visibility into supply chains makes businesses better. They are the ying and yang of more sustainable consumer goods for all of us and for the planet.

In 2017, we saw an unprecedented increase in the implementation of our work. And we saw more companies commit to improve their performance. This was a clear response to the demand signal from retailers, brands and other major purchasers to improve supply chain visibility, understand sustainability impacts and take action to improve. It’s also a positive response to growing consumer demands and pressure as well as another endorsement of the idea that sustainability is good for business.

Euan Murray Quote

There’s no shortage of sustainability issues to tackle and we are already deep into most of them.

In this impact report you’ll find analysis and highlights of our more recent data that shows the improvements we are making in driving visibility, uncovering hotspots and driving action. You can learn about our new Innovation Projects, designed to bring together like-minded organizations to tackle some of the toughest hotspots they can’t tackle alone. Through the full breadth and depth of all we are working on, you will get a sense of the energy, commitment and resourcefulness of our members to deliver on our mission.

As I often say–our members are the driving force behind all we do. I am thankful especially for our progressive members and industry leaders who push us for solutions, our university partners for keeping us grounded in the science-based metrics we were founded on, and for everyone around the world demanding more sustainable products for a sustainable planet.

As TSC heads towards 2019, we will celebrate our 10-year anniversary and the $200+ billion in retail sales that we have impacted. But we still have a lot left to do. Please continue to get involved and let your voice be heard so we can, together, drive sustainability impact at scale.

Euan Murray

Euan Murray
Chief Executive
The Sustainability Consortium

Executive Summary

The theme for this year’s Impact Report 2018 is increasing transparency. The phrase is an aspiration, a process, and an outcome.

As an aspiration, customers and investors are increasing their demand for transparency in consumer products. They want to know how it is made, where it is made, what it is made of, and how to properly use and dispose of it. Organizations that are more transparent with the answers to these questions build more consumer and investor trust, which leads to loyalty and positive business value. When transparency is rewarded, it is confirmation that markets care about sustainability.

As a process, we need significant action to move increasing transparency from a catchy phrase to an operational strategy. There are many reasons why consumer product value chains lack transparency, and these reasons go well beyond an organization simply not wanting to be transparent. Most companies lack awareness of what their direct, tier-one suppliers are doing with regards to sustainability. When we extend the need to the entire extended supply network, it is a blind spot for many. Technology is coming to the aid of these challenges, but it still requires hard work and consensus building to developing standard, shared systems that enable better transparency.

As an outcome, the bottom-line question is: are we actually increasing transparency? Or is this just window-dressing?

We’re proud to report in 2018 that The Sustainability Consortium has made significant progress on all three aspects of increasing transparency.

Increasing transparency is at the heart of TSC’s theory of change, which proposes that retailers need to be transparent about the sustainability issues most important to them to drive a consistent signal, and that product manufacturers need to be transparent about the sustainability performance of their product supply chains.

TSC’s science-based approach shows that most environmental and social hotspots exist within a product supply chain, or with the customer at product use and end-of-life stages. Therefore, most of TSC’s key performance indicators (KPIs) that suppliers report on are about the degree of transparency that a brand has into its value chain. These KPIs are scored so that perfect transparency results in a perfect score. If you do well in The Sustainability Index it means you have excellent transparency.

TSC and its partners and members have engaged in a range of projects this past year to increase transparency. Four examples:

Under the banner of our Innovation Program, TSC’s leadership in the Responsible Battery Coalition will increase transparency around the environmental, social, and economic challenges associated with recovery and re-use of Lithium-Ion batteries, a product category currently experiencing growing production and sales. This project will provide battery manufacturers a way to demonstrate transparency in terms of how their batteries are managed after first-use.

In our Measurement and Reporting Program, the Agricultural Metrics Task Force has worked to understand how data flows, or doesn’t, across Ag supply chains, and how metrics used by different IT and service providers map to one another. As a result, the Walton Foundation funded a Commodity Supply Chain Project that has brought together all relevant stakeholders to develop interoperability within Ag supply chain sustainability data systems.

In the Beauty and Personal Care, TSC worked with Forum for the Future to develop a product-level sustainability scorecard that five different retailers – CVS, Sephora, Target, Walmart, and Walgreens – have all agreed to use. This is unprecedented in creating a consistent, transparent market signal from the retailers on what is most important, and provides product manufacturers the mechanism to deliver transparency to a market segment that demands it.

These are only a few examples of the numerous projects TSC is involved with or leading that are contributing to increasing transparency.

Finally, we’re happy to see that the 2017 Sustainability Index data, primarily used by Walmart and Sam’s Club, suggests that supply chain transparency really is increasing. Comparing data from 2016 to 2017, we see that fewer organizations have had to choose the KPI response “Cannot determine at this time”. Comparing only suppliers that participated in both years, and only including KPIs that did not change, the average supplier score went from 33.3% in 2016 to 36.0% in 2017.

From our experience in talking with suppliers, it’s our observation that increases in scores have occurred in part because brand manufacturers have improved the capacity of their data systems to have greater transparency into what is happening. Suppliers who participated in TSC’s training sessions were asked if they had done anything in the past year to improve their Sustainability Index score, and 88% answered yes, with over half of those suppliers saying that they had engaged their own suppliers around sustainability performance and relevant data. This is all positive evidence that increasing transparency is happening as a measured outcome.

The 2018 Impact Report will be released adaptively. You can find the core sections here now, and we will release case studies about increasing transparency and other sustainability outcomes throughout the rest of the year. We hope you enjoy learning about what has been accomplished, and it inspires you as to what we all can achieve in the near future.

Kevin Dooley

Kevin Dooley
Chief Scientist
The Sustainability Consortium

Dr. Kevin Dooley Presents our 2018 Impact Report at TSC Summit in Chicago

Who Is TSC?

Over the past decade, TSC has grown from a revolutionary solution for supply chain transparency, to a thriving hub for innovative collective action in the consumer goods industry. The unique spirit of TSC’s visionaries, made up of staff, stakeholders, and followers, has led our way while naturally carving-out the values that we live by today. Our core values support our vision and mission and are at the center of who we are as an organization.

TSC Vision

Our Vision

We envision a world in the near future where we can experience the benefits of consumer products without causing harm to people or going beyond the environmental limits of our planet.

TSC Mission

Our Mission

To use the best sustainability science to help companies make the everyday products we use better and more sustainable.

TSC Values

Our Values

We work to achieve our mission according to these value principles that we share with our members and the outside world: science-based sustainability, collaboration, and impact.

About Our Values

Science-based Sustainability
Science-based sustainability involves materiality, thorough literature review, referencing high quality publications, member engagement, and action-ability. TSC is committed to science-based approaches that continuously improve the sustainability of consumer products. We support research, supply chain engagement, and innovation in all areas of sustainability using our unique methodology and role in the industry.

Collaboration
We value teamwork and engagement throughout our organization and consumer product supply chain research. We engage internally across our global staff network to share strengths and ideas. We collaborate externally with members, partners, and invited participants to establish teams and build trust to achieve our collective goals.

Impact
We focus on systems and approaches that have the greatest positive impact on environmental and social change in the consumer goods industry. We aspire to achieve our mission by reducing impact on the planet and improving the lives of people through ongoing development of our tools, projects, and services.

TSC Turns 10

In 2019, TSC will celebrate our ten-year anniversary from when the MOU was officially signed between the University of Arkansas and Arizona State University. Although TSC in our current form has only been around for ten years, the engine and ingenuity behind us has been around much longer. Since the earliest days of sustainability, an organization with a science-based measurement and reporting system for measuring the supply chains of consumer goods had always been a gleam in the eyes of our founders.

I’m not sure our founders and our founding members would like being called revolutionaries, but they were. They had a vision and took a risk. It’s that vision, the opportunity to help create more sustainable products for a sustainable planet, and a small investment that created the TSC that we are today.

Ten years after our founding, TSC covers over $200B+ in retail sales. Our measurement and reporting system covers almost 90% of all consumer goods produced. And our implementation and innovation initiatives work hand-in-hand with all of our retail partners and are tackling some of the biggest sustainability challenges we have today.

We wouldn’t be here without our dedicated members and partners or our mission, which is the heartbeat of TSC. Helping to create a more sustainable planet drives us every day, pushes us forward and keeps us relevant. A quick look at our staff page will show you that many of TSC staff were there in the beginning and still working with us today.

Join us in 2019 as we celebrate the people, members, places and events that created TSC over the last decade, and the places we’ll go in the next.

Erika Ferrin

Erika Ferrin
Senior Director, Marketing, Communications & Development
The Sustainability Consortium

Chapter 1

Sustainability Measurement and Reporting

TSC’s mission is “to use the best sustainability science to help companies make the everyday products we use better and more sustainable.” The way we operationalize this mission is by developing and helping companies implement systems for sustainability measurement and reporting. Our theory of change is that when retailers and brand manufacturers use their market and purchasing influence in positive, developmental ways, they can change the worlds’ supply chains. No government policy or regulation can work as quickly and comprehensively as a global supply chain can in terms of incentivizing and supporting sustainable change.

Measurement and reporting, or more generally, measuring what’s important and then sharing it with stakeholders, is the essence of transparency. Transparency in product sustainability is hard to do, though, because most of the environmental and social “hotspots” exist upstream or downstream from the brand manufacturer and retailer. Thus, product transparency for a retailer or manufacturer involves knowing what is happening in your upstream supply chain, and what happens to your product at end-of-use. Without transparency, consumer and investor trust is challenged, and opportunities for collective action are lost. Transparency is the first necessary step towards improving supply chain performance.

To achieve our mission, TSC developed an evidence-based process to assess sustainability materiality assessment across the different product categories found in consumer goods retail outlets. By using published science as a foundation, TSC established consensus amongst the diverse stakeholders on hotspots. TSC stakeholders and staff then worked together to develop key performance indicators (KPIs) so that retailers can ask their suppliers to measure and report their performance and progress on the relevant hotspots.

KPIs need to be “scored” in some way so that suppliers and retailers can make sense of what the responses mean in terms of better or worse performance. TSC staff and stakeholders collectively decided that the best solution for many KPIs was to score them, where appropriate, based on the level of transparency the brand manufacturer has with its supply chain practices. For example, a brand selling fish-based products will need to address how an issue like (e.g.) bycatch-reduction is being addressed in the fisheries it sources from. The KPI score ranges from 0 to 100% and corresponds to the percentage of fish supply that came from fisheries who had a by-catch reduction program.

The KPI is meant to increase transparency in a number of ways:

  • The retailer is being transparent with the brand that bycatch-reduction is a materially important issue to them. This enables the brand to communicate that expectation with its supply chain, creating transparency between the retailer and fishery supply chain.
  • The score, measured and reported annually, enables a transparent, evidence-based discussion on progress between the retailer and the brand.
  • In order to answer positively to the KPI, the brand needs to know where and who its fisheries are. If it doesn’t know that already, then the mapping of that extended supply chain will benefit the brand in terms of knowing the regions they source from – and the corresponding risks and opportunities.
  • In order to know whether the fishery has a bycatch-reduction program, some form of communication and thus relationships will have to be created within the extended supply chain, further increasing transparency.

TSC’s KPIs have been used for the longest period of time, and most broadly by Walmart and Sam’s Club, as part of The Sustainability Index. The Sustainability Index has been on-going since 2014 and serves as a measure of the current state of consumer product sustainability. To the extent that most of the KPIs link their score to the level of transparency, it also is a proxy for the amount of transparency present within consumer good supply chains.

In 2017, a total of 1,683 suppliers reported to The Sustainability Index. Most suppliers responded to surveys covering one or two categories, while a handful replied to a dozen or more categories. In 2016, these suppliers represented over $200 billion in annual sales to Walmart or Sam’s Club. The market signal of The Index though is bigger than this $200 billion – as manufacturers make improvements in their product and supply chain sustainability, it benefits all the retailers (and consumers) they sell to, not just Walmart or Sam’s Club.

The distribution of supplier scores is shown in the figure below. The average supplier survey score was 36 out of 100. You can see the most common supplier score was at the low end (0 to 10 out of 100), while some suppliers scored above 50 or better.

Sustainability Index 2017 Supplier Survey Scores

What does a score of 36 out of 100 practically mean? Every product category survey has between 10 to 15 KPIs to answer, and each KPI has a score of 0 to 100%. A score of 36 roughly corresponds to a scenario where the supplier scored 100% on one-third of the KPIs and scored 0% on two-thirds of the KPIs. As the most common KPI score across all suppliers and KPIs is either 0 or 100% on many KPIs, this scenario is a good description of the most likely case.

This means that on some of the hotspots (likely within their own manufacturing operations), they have full transparency, but on the majority of them (likely within their supply chain), they do not. For most suppliers who are not scoring in the upper echelons, the only way to improve their score is for them to improve supply chain transparency.

We asked suppliers who had participated in training provided by TSC if they had done anything in the past year to increase their KPI scores. From the 63 respondents, 88% of the suppliers indicated they had taken specific action(s) to increase their survey score, a strong confirmation of our theory of change.

As can be seen in the chart below, the majority of supplier actions involved increasing transparency, internally and externally. Over 50% of those who had taken action indicated that they had worked with suppliers to increase transparency into the supply chain. Close to 40% indicated they had worked internally to increase transparency. Often, good and actionable sustainability data exists, but it is dispersed in the company in different functional organizations. To understand performance holistically, these dispersed data need to be brought together, which is where systems development is needed.

The final bar shows that about 15% of suppliers made new public disclosures regarding their sustainability performance. This speaks directly to the KPIs incentivizing increased transparency. By including a requirement that goals or performance need to be disclosed to public within many of the KPIs, suppliers have taken action to do so.

About 25% of suppliers made changes to their processes, and 15% made changes to their product or its packaging to make it more sustainable. This represents concrete action beyond transparency. While we cannot know how representative our sample is, if these numbers are at all representative, it infers significant impact when spread across 1683 suppliers representing $200 billion in annual sales.

Taking Action to Improve Sustainability Index Scores

Because The Sustainability Index has been on-going for a number of years, it’s possible to begin to look at year-over-year progress. The chart below shows the changes in score, at the KPI level, from 2015 to 2017, across all suppliers and product categories. For comparison purposes, we have only included suppliers reporting in each year, and only those KPIs that did not change over the time frame. The number of KPI scores between 0 and 10% has decreased from 50% to 48% from 2015 to 2017. The number of KPI scores between 90 and 100% has increased from 22% to 26% from 2015 to 2017.

On one hand, it is encouraging that the trend is statistically significant and in the correct direction. On the other hand, the percentage of “Unable to determine at this time” responses is still much too high.

Overall, the average KPI score improved from 34 in 2016 to 36 out of 100 in 2017. This is a 2% increase absolutely, and around a 6% relative increase from baseline.

Changes in Sustainability Index Scores

While there’s evidence that some suppliers are increasing their internal and external (supply chain) transparency, is it practically doable for a typical supplier? Is this only something leaders can do, or can it become standard practice more broadly?

The year-to-year comparisons suggest that most companies are likely to be able to improve their transparency over a period of one to two years – it just takes the effort and time to implement the systems and routines to do so. The chart below shows the average supplier score broken into three supplier types – those who participated in all three years (2015-17), those who participated in the previous two years only (2016-17), and those who participated for first time in 2017.

The data shows that suppliers who:

  • Only reported to Index in 2017 scored on average a 36.4
  • Reported to Index in 2016 and 2017 scored on average a 40.7
  • Reported to Index in 2015, 2016, and 2017 scored on average a 46.8.

Thus, those with less experience reporting to The Index scored lower. If we couple this with the numerous observations and feedback TSC has gotten during supplier training sessions and at our help desk, as well as the supplier action data discussed above, it is our hypothesis that after learning what is needed to respond to the KPIs in their first year of implementation, suppliers put in systems that give them the increased transparency to score higher in subsequent years.

Sustainability Index Value Engagement

You’re probably curious about what additional insights and surprises are in store by analyzing the year-to-year data we now have. Over the next few months, we’ll publish additional chapters that do a deeper dive into the year-to-year comparisons, as well as highlight the categories that scored highest on average in 2017.

Chapter 2

Innovation Program

We are involved because we believe that this initiative will help to create the next chapter of good corporate citizenship in the apparel industry through the preservation of our waterways benefiting communities and people around the globe where we operate.

– Roian Atwood, Wrangler, Project Champion for TSC’s Wastewater Innovation Project

HanesBrands is participating in The Wastewater 101 Toolbox project because the direct discharge of untreated wastewater to the environment is relevant and material to textile manufacturing. It is our desire to level the playing field within the apparel industry through project deliverables that develop and promote the wide-spread adoption of proper wastewater treatment practices.

– Philip Henson, HanesBrands, Project Champion for TSC’s Wastewater Innovation Project

These quotes reveal the essence of TSC’s Innovation Program – a space for driving impact through collective action.  This collaborative space is the vision of TSC members interested in leveraging TSC’s convening power and sustainability expertise to bring together like-minded, leading companies, NGOs, and other stakeholders to tackle sustainability hotspots that can’t be solved by individual action alone.   

Our Innovation Program is a collective-action model that makes rapid, market-changing improvements. The goals of the program are to:

Create impact at scale

Drive sustainability leadership

Grow and expand TSC’s network

The program’s success is measured on the ability to tackle the biggest sustainability challenges in supply chains. Participants in the program leverage TSC’s skills in convening diverse stakeholders, mediating conflicts, researching issues, and creating practical solutions that drive impact.

It is TSC’s network of industry leaders that drives this program. The program focuses on empowering TSC members and stakeholders to bring ideas forward for projects that align with their sustainability goals and commitments. This participant-led approach is a crucial part of the program’s theory of change because it is only through partnership that these big challenges will be overcome. To nurture that aspect of the Innovation Program, a process has been set up to ensure that project ideas are vetted by a wide array of stakeholders, including TSC leadership, TSC Board of Directors, as well as reviewed by TSC’s Tier 1 members. If you are interested in getting involved in TSC’s Innovation Program and its projects, please contact Dr. Sarah E. Lewis.

Our Innovation Program allows TSC members to bring both their expertise and their organizational needs together to tackle sustainability hotspots identified by TSC metrics and research.

Sarah Lewis Quote

– Sarah E. Lewis, The Sustainability Consortium, Senior Director, Innovation

The process is designed for members to be part of:

This approach is helping to foster leadership in sustainability as we progress with existing projects led by champions, such as:


The pipeline of projects is filling up after only one year of TSC’s Innovation Program. There are several active projects spanning across a variety of issues and sectors, over 43 organizations actively participating, and upwards of 200 participants engaging in different ways.

The current innovation pipeline includes projects that are:

focused on improving circularity in battery value chains regardless of the chemistry used

focused on improving the sustainability of coffee through improved understanding of sourcing regions and improved planting practices

investigating the major barriers to treating wastewater in the textiles industry and creating a toolbox of resources for brands, managers, and operatorsrs, and operators

examining the factors that lead to food being lost or wasted instead of reaching families and children in need across US communities

exploring how to create a common language and measurement approach for integrated pest management (IPM)

identifying methods that brands can use to identify and address worker exploitation across their global supply chains.

TSC’s role varies with some projects fully led by TSC, while in others TSC participates or contributes. All projects are multi-stakeholder and science-led, and the objectives of each are meant to be clearly defined with an iterative and flexible process.

This ever-expanding and exciting list of projects demonstrates the diversity of stakeholder engagement in TSC. TSC has an extensive network of experts that we can leverage to create a collaborative space where participants can come together to drive impact and improve product sustainability

Chapter 3

60 and Up Club

The Sustainability Index, powered by TSC, is an unmatched resource for measuring the state of supply chain transparency in the consumer good industry. We are happy to highlight those product categories who achieved the highest average Index and are part of our 2018 60 and Up Club! The Club Members are product categories whose suppliers scored well on the 2017 Sustainability Index surveys, 60 or above out of a 100-point scale.

We have only noted high scoring categories that consisted of five or more reporting suppliers. Joining us this year are categories that also made it last year, Computers (average score of 62.0) and Diapers (60.5). New to the Club this year are Apples and Pears (67.4), Stone Fruit (62.6), Hair Coloring Products (61.2), and Cucumbers, Melons, & Squash (61.2).

The 60 and Up Club

Apples and Pears Sustainability Index
Apples and Pears
Index: 67.4

Computers Sustainability Index

Computers
Index: 62

Diapers Sustainability Index
Diapers
Index: 60.5

Stone Fruit Sustainability Index

Stone Fruit
Index: 62.6

Hair Coloring Products Sustainability Index

Hair Coloring Products
Index: 61.2

Cucumbers Sustainability Index

Cucumbers, Melons, and Squash
Index: 61.2

In addition to the specialty crops highlighted, honorable mention goes to several other specialty crops, all that scored between 55 and 59: Berries and Grapes; Lettuce and Leaf Vegetables; Root Vegetables; Tomatoes, Peppers, and Eggplant; and Tropical and Specialty Fruits.

The positive performance across so many different specialty crop categories suggests that supply chain transparency is increasing because of capabilities that are common across these different crop types. Specialty crops tend to have shorter supply chains than commodity crops or complex food products, and so traceability may be more likely to be achieved. Likewise, the shorter supply chain distance makes it more probable that downstream buyers (brands and retailers) can form trusting relationships with growers, making data sharing more plausible.

Apples Supply Chain Diagram

Specialty crops also have the advantage of being “discrete”. As a physical item, an apple or cucumber is typically aggregated into batches whose identity can be tracked. Contrary to a commodity item like grain, specialty crops are not mixed so as to be indistinguishable from one another within the aggregate. Traceability is also facilitated by food safety requirements for specialty crops that exist in most developed countries.

We can dig a bit deeper into the highest scoring category, Apples and Pears, to identify the particularly strong areas of performance. All reporting suppliers responded that they conducted crop supply mapping for 100% of their crop. Most suppliers had complete or almost complete knowledge of critical issues within growing operations: deforestation, irrigation water use, labor rights, pesticide application, and yield. Additionally, most suppliers were tracking food waste in their distribution channels.

Crop Supply Mapping Apples Pears

All reporting suppliers responded that they conducted crop supply mapping for 100% of their crop. Most suppliers had complete or almost complete knowledge of critical issues within growing operations:

Similarly, in Stone Fruit, a strong majority of suppliers are conducting crop supply mapping, and there is strong visibility into irrigation water use, labor rights, pesticide use, worker health and safety, and yield in growing operations.

Computers repeat as a high scoring category. As we mentioned in last year’s Impact Report, the electronics industry has a history of working together, in part to address the benefits of having common technical standards, and in part to address regulatory issues in a shared and standardized way. As the sector turns to addressing sustainability issues, it has these long-standing partnerships and strong industry associations, such as the Responsible Business Alliance, to facilitate progress. The computer category in particular has benefited from broadly adopted eco-certifications, like ENERGY STAR(c) and EPEAT, which has helped drive sector manufacturers to focus on the key sustainability issues within their own operations and their suppliers. Areas where computer suppliers showed particularly strong performance were conflict minerals management, energy savings in use phase, hazardous substance disclosure, product takeback management, responsible battery management, and supply chain working conditions.

Diapers also repeated its high scores from last year. Diaper manufacturing is a relatively mature industry. Competition had led to low margins, driving consolidation and vertical integration. The materials in a diaper drive both its cost and carbon footprint, so efforts aimed to reduce one have reduced the other as well. The high degree of vertical integration increases the ability of a diaper manufacturer to connect with the different facilities across the product’s life cycle and build relationships with each of the component manufacturing facilities along the value chain. Diaper suppliers performed well across almost all of the hotspot issues, scoring highest on their management of bleaching chemicals and certification of the wood fiber sources they use.

The Hair Coloring Products category has many of the same industry characteristics as Diapers. The dynamics of competition have led to consolidation, and thus the suppliers that remain tend to be larger and have strong operational capabilities and influence over their supply chains. Concerns around chemicals within hair coloring products has led suppliers to be more transparent about their formulations. Hair Coloring Products suppliers performed most strongly on KPIs related to alternative approaches to animal testing, fragrance safety, priority chemicals disclosure and safety, water use in manufacturing, and worker health and safety in their supply chains.

Case Studies

TSC’s reach spans across the entire consumer goods industry. Our case studies tell the stories of our impact, the science behind our work, and the people and companies who are working with us to make more sustainable products for a sustainable planet.